Examples
GeoJS has many features, some of which are shown off in these examples. Some of the examples are intended to showcase all of the options of a feature, such as the Tile Layer. Other examples show how real data can be visualized, such as the Hurricane Tracking Data. Each example has commented source code.
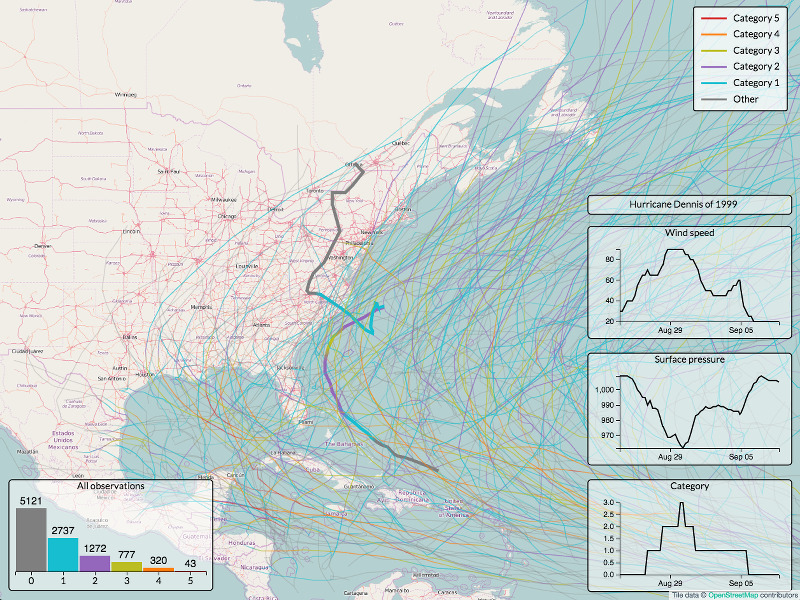
Hurricane tracking data
Explore historic hurricane paths since 1980 on an interactive map.
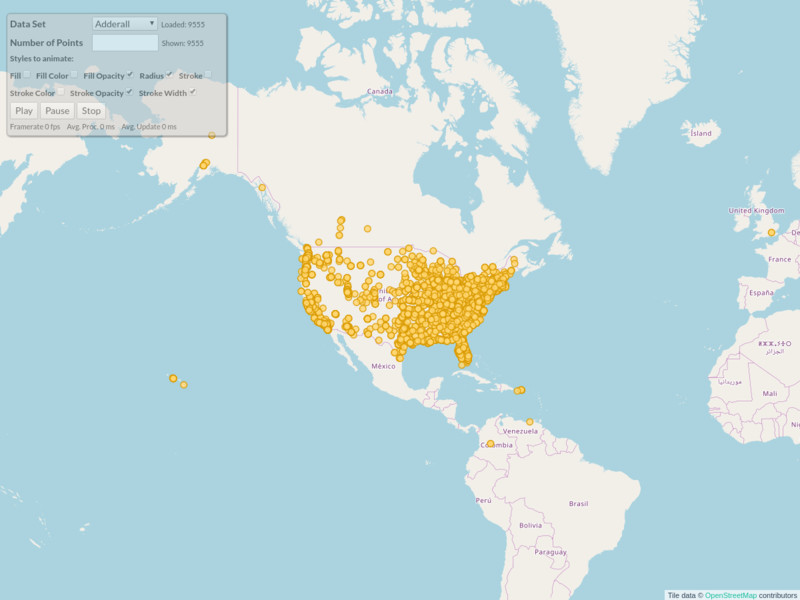
Animate Features
This example shows how to animate features by updating styles.
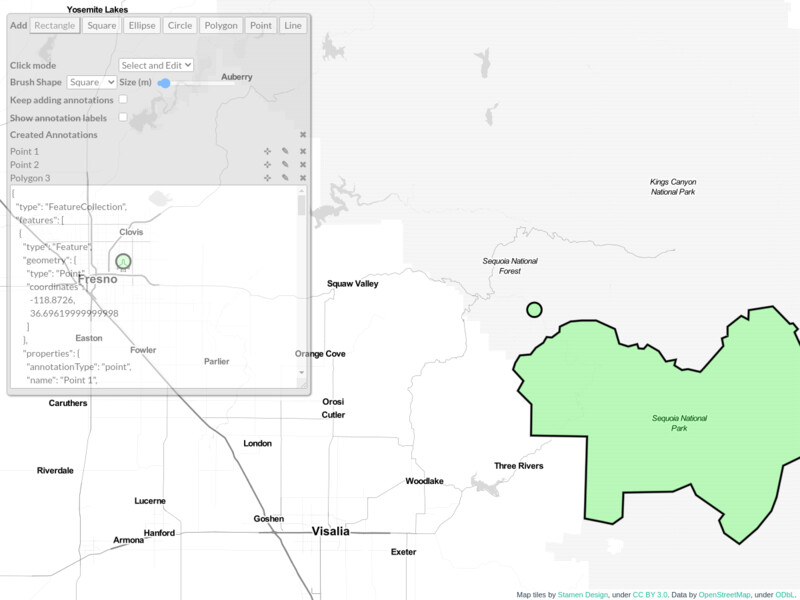
Annotation Layer
This example shows how to add annotations, such as marked rectangles, to a map.
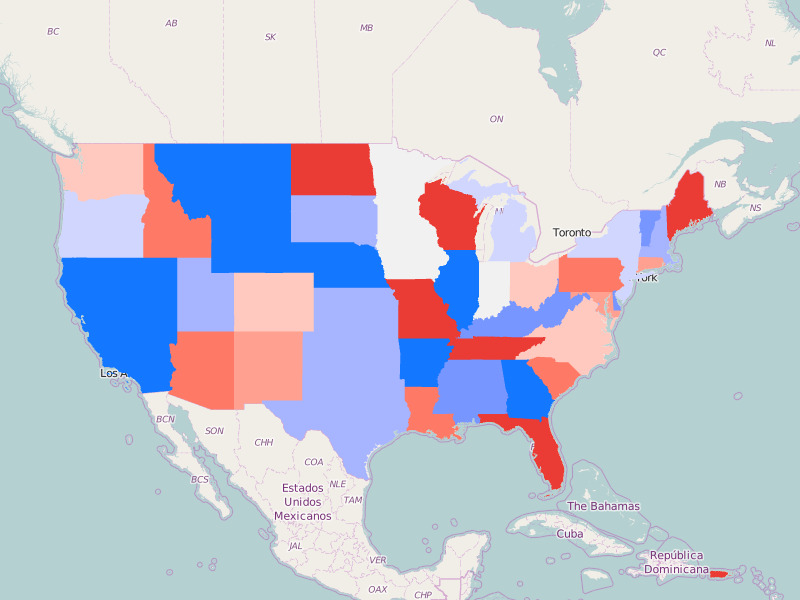
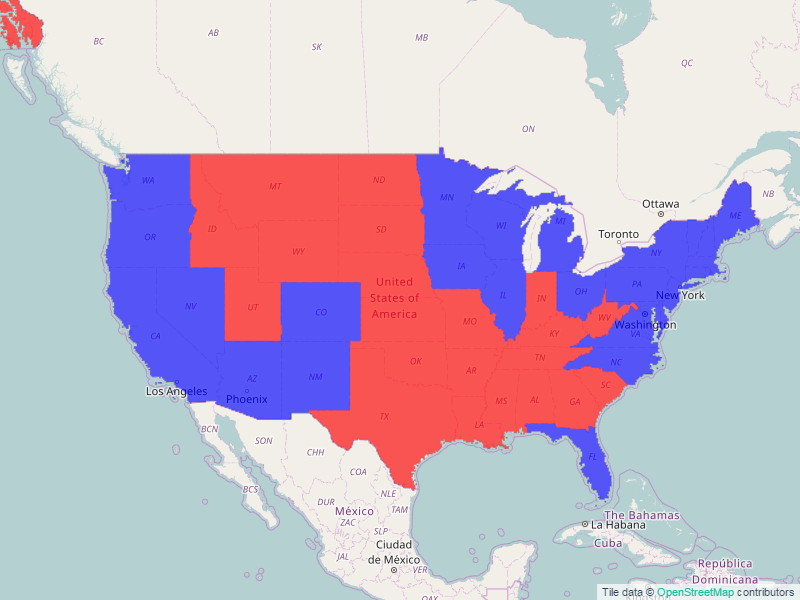
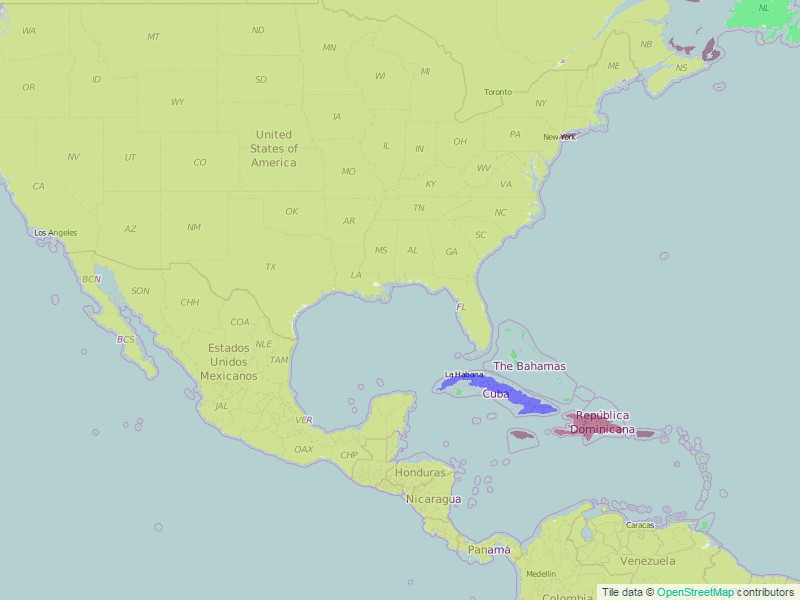
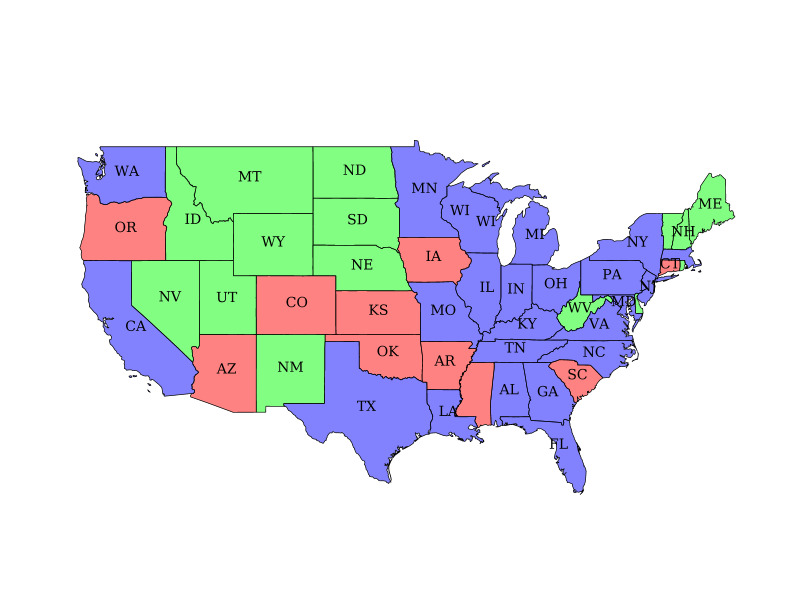
Choropleth plot
This example shows how to add choropleth features to a map. Choropleths color each region in a set of regions based on a scalar value for each region.
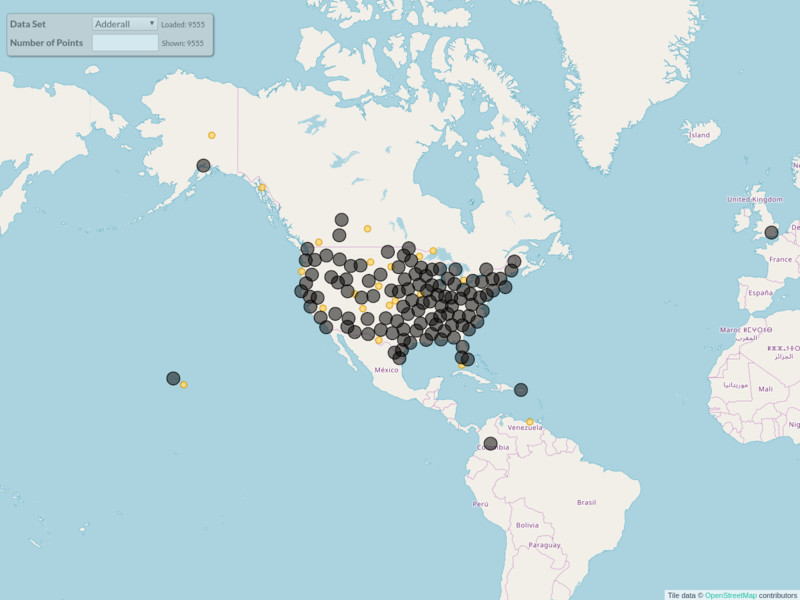
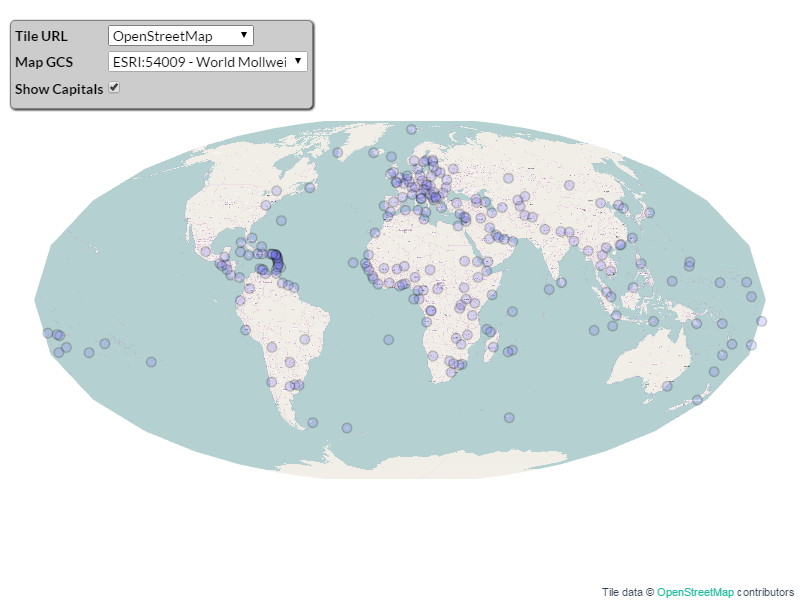
Cluster points
Cluster nearby points on a map.
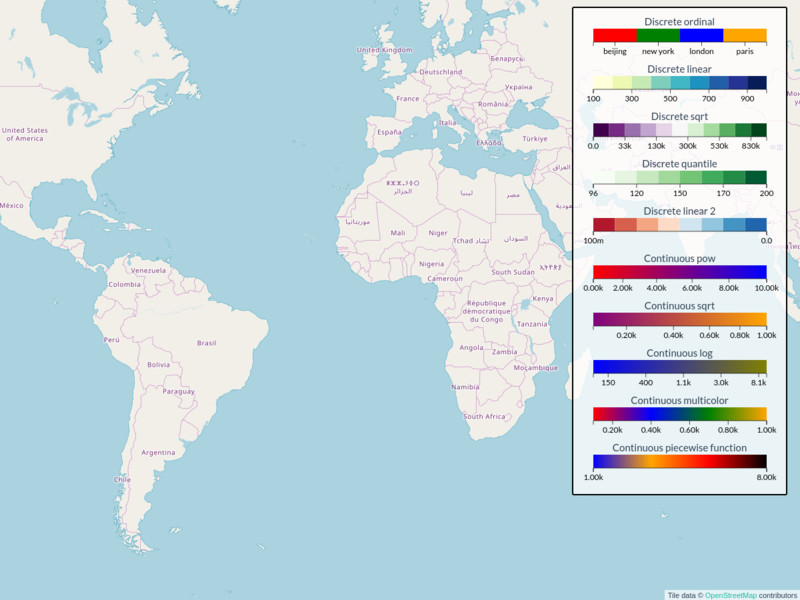
Color legends
This example shows how to create a discrete or continuous color legends.
Contour plot
This example shows how to add contour features to a map. Contours color a region based on an array of scalar values. If stepped colors are used, these are called isobands.
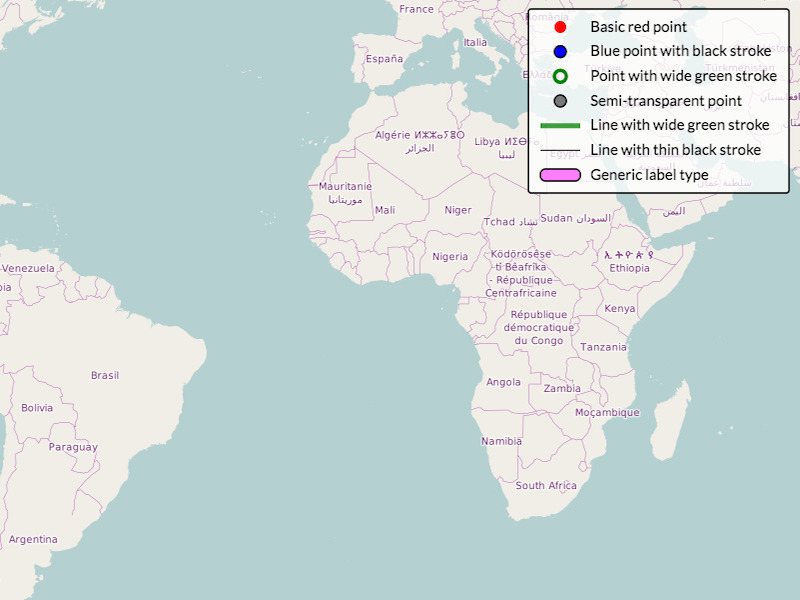
Feature legends
This example shows how to create a legend to describe feature styles on a map.
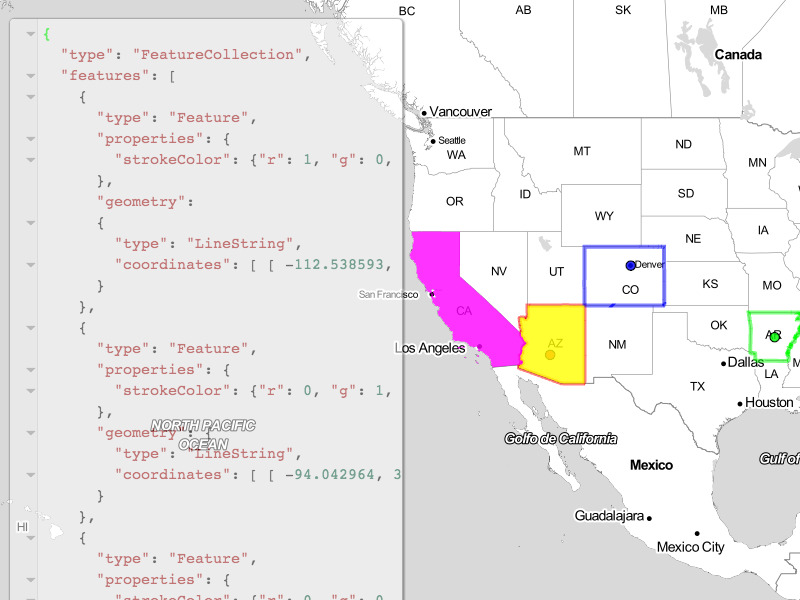
GeoJSON file reader
Shows how to use the included geoJSON reader, and how to use the properties to adjust the style of the features. In this example, you can edit the json file while the features on the map update in response. You can also drop a new geoJSON file onto the text editor to load it.
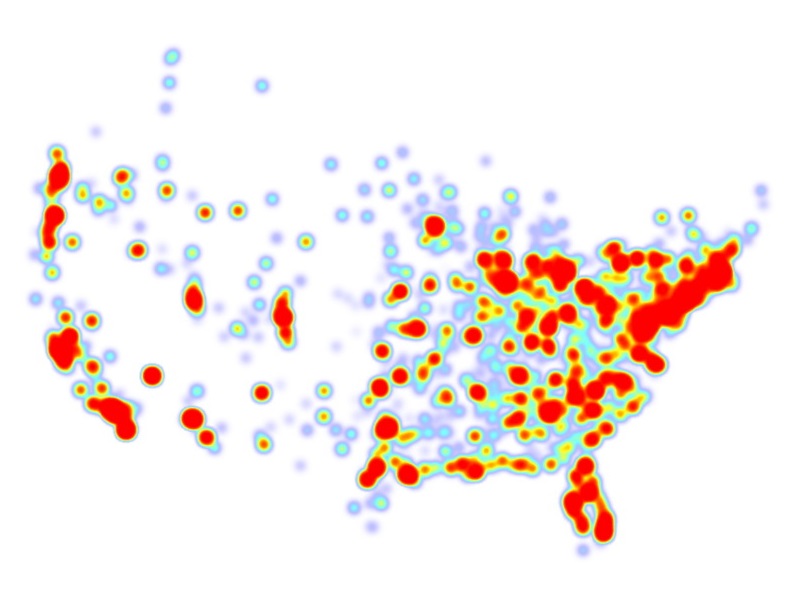
Heatmap Feature
This example shows how to add a heatmap to a map.
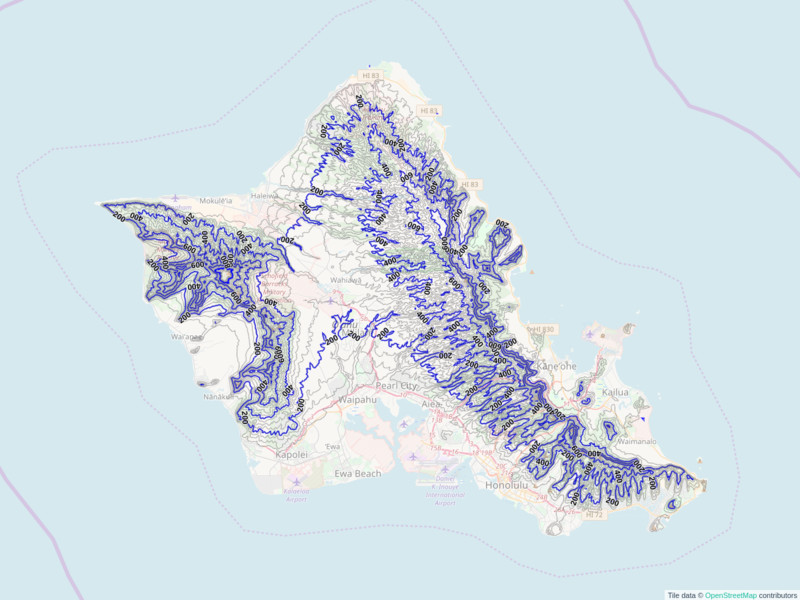
Isolines
This example shows how to add isolines to a map.
Line Feature
This example shows the variations that are available for line features.
Map Widgets
This example shows how the widgets API can be used to place elements on top of the map.
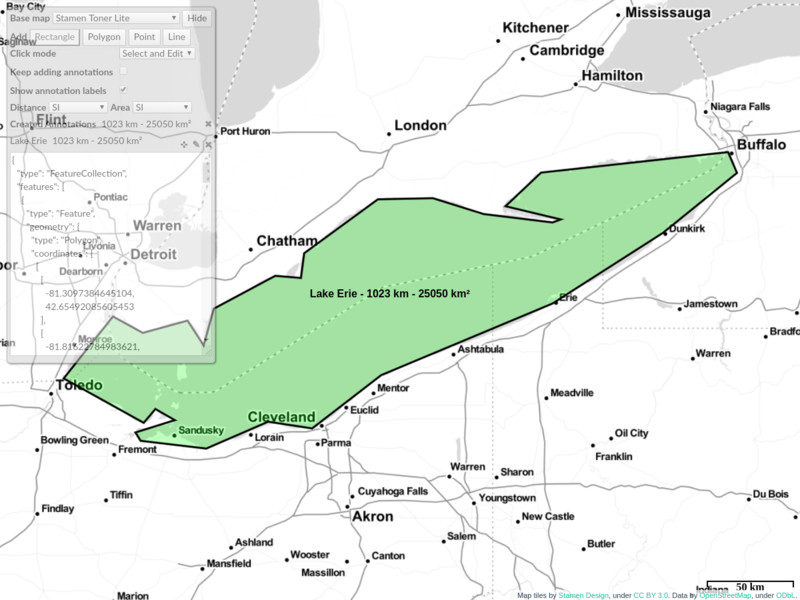
Measure Annotations
Show lengths and areas of annotations. This shows how annotations can be altered while being drawn. Areas are computed using an equal-area projection.
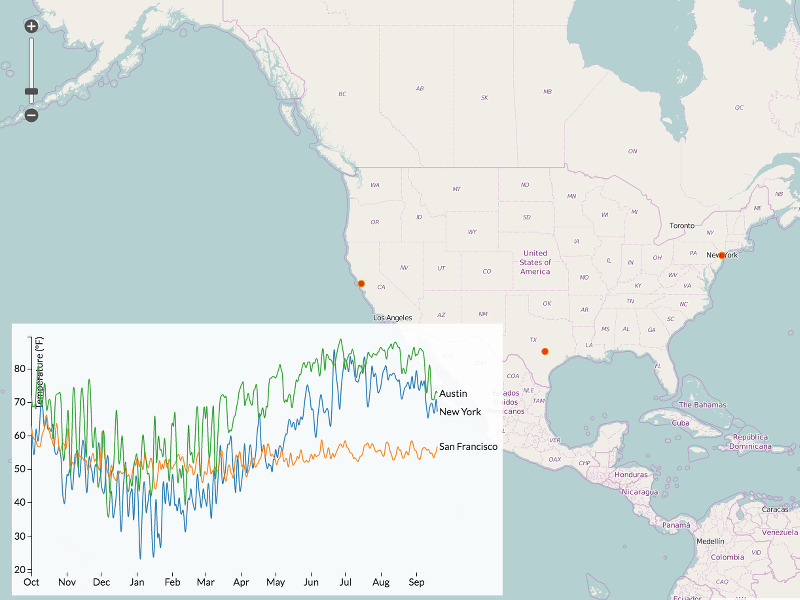
One map set inside another.
This example show how two maps can be made to move together and show similar, but different data.
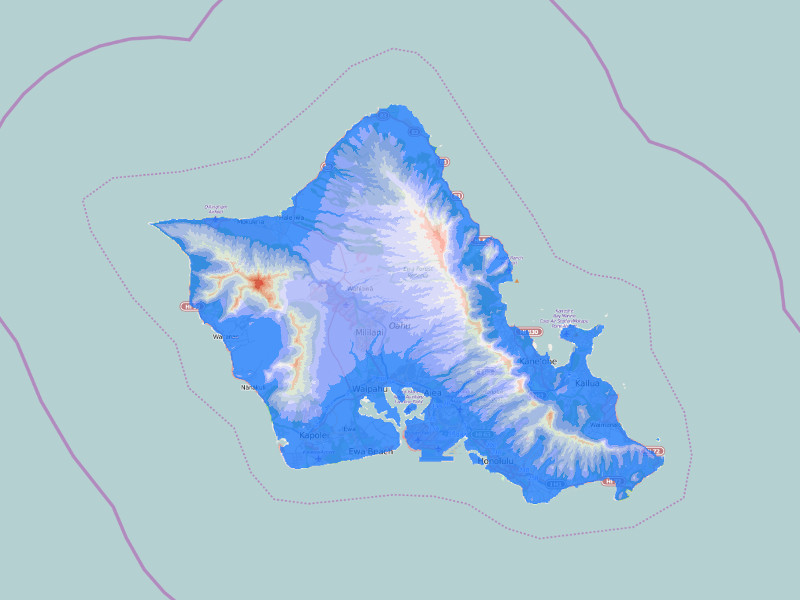
Pixelmap feature
This example shows how to use a pixelmap feature. The pixelmap colors areas based on an index derived from an image and some data per index.
Polygon features
This example shows how to add polygons to a map.

Rainfall - Annual precipitation totals
Show isolines and contours of annual precipitation totals in the United States and nearby areas.
Rendering tiles from a WMS server
Rendering tiles from a WMS server by customizing the tile URL of an OSM layer.
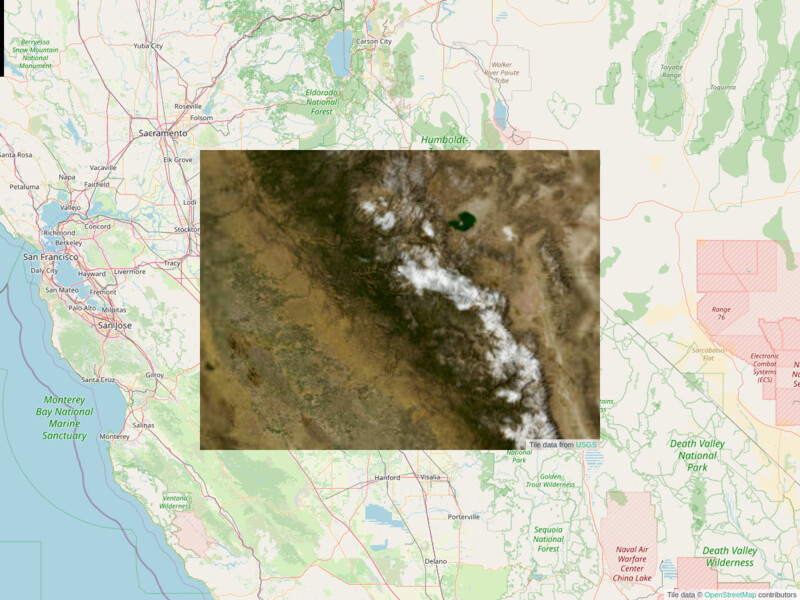
Reproject tiles
This example shows how you can reproject tiles from one projection to another. The source tiles are in Web Mercator (EPSG:3857), but can be drawn in many different projections.
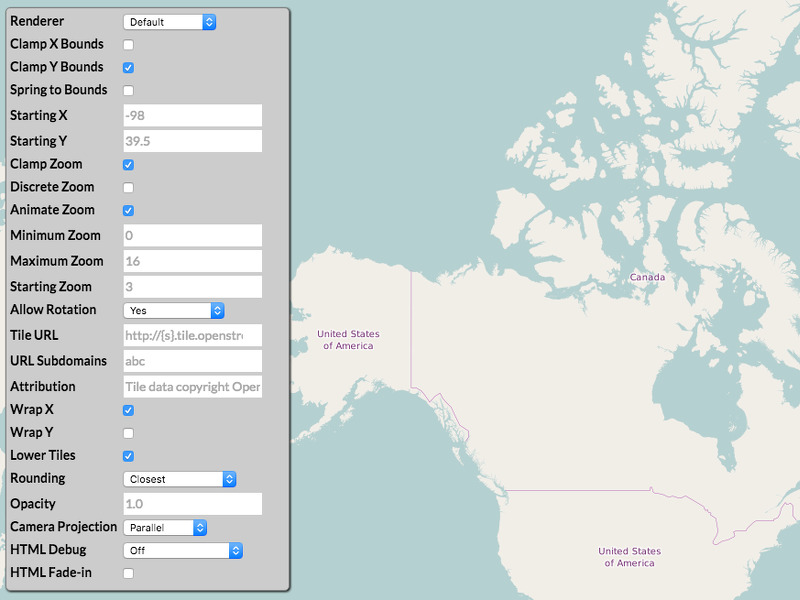
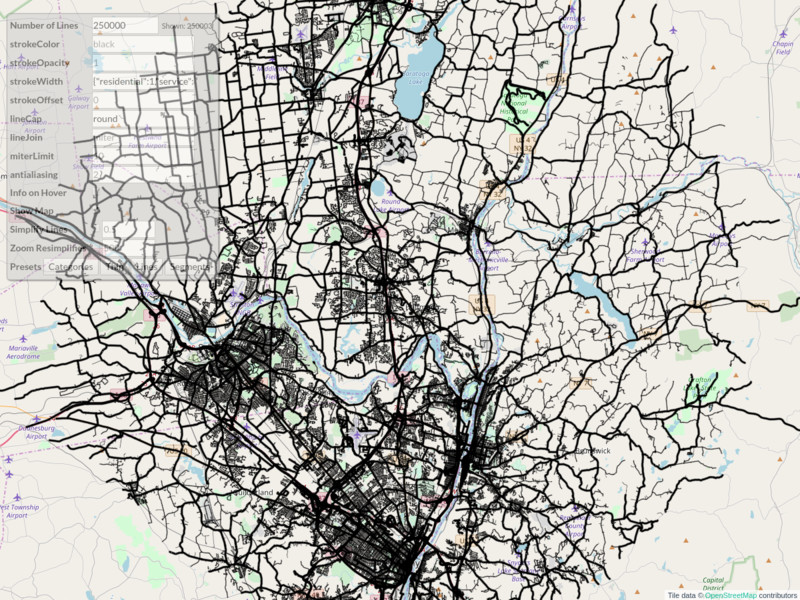
Tile layer with controllable options
This example provides controls for changing many options on tile layers. The code and query parameters allow even more options to be adjusted.
Using animated transitions
Using animations to transition between points on a map.